

In our study of AC circuits thus far, we've explored circuits powered by a single-frequency sine voltage waveform. In many applications of electronics, though, single-frequency signals are the exception rather than the rule. Quite often we may encounter circuits where multiple frequencies of voltage coexist simultaneously. Also, circuit waveforms may be something other than sine-wave shaped, in which case we call them non-sinusoidal waveforms.
Additionally, we may encounter situations where DC is mixed with AC: where a waveform is superimposed on a steady (DC) signal. The result of such a mix is a signal varying in intensity, but never changing polarity, or changing polarity asymmetrically (spending more time positive than negative, for example). Since DC does not alternate as AC does, its "frequency" is said to be zero, and any signal containing DC along with a signal of varying intensity (AC) may be rightly called a mixed-frequency signal as well. In any of these cases where there is a mix of frequencies in the same circuit, analysis is more complex than what we've seen up to this point.
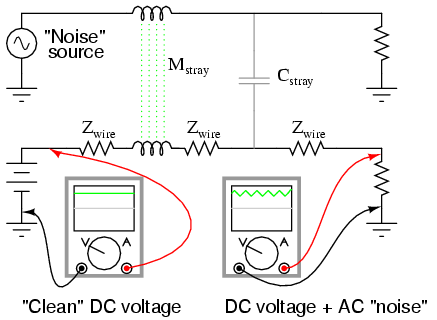
Sometimes mixed-frequency voltage and current signals are created accidentally. This may be the result of unintended connections between circuits -- called coupling -- made possible by stray capacitance and/or inductance between the conductors of those circuits. A classic example of coupling phenomenon is seen frequently in industry where DC signal wiring is placed in close proximity to AC power wiring. The nearby presence of high AC voltages and currents may cause "foreign" voltages to be impressed upon the length of the signal wiring. Stray capacitance formed by the electrical insulation separating power conductors from signal conductors may cause voltage (with respect to earth ground) from the power conductors to be impressed upon the signal conductors, while stray inductance formed by parallel runs of wire in conduit may cause current from the power conductors to electromagnetically induce voltage along the signal conductors. The result is a mix of DC and AC at the signal load. The following schematic shows how an AC "noise" source may "couple" to a DC circuit through mutual inductance (Mstray) and capacitance (Cstray) along the length of the conductors.

When stray AC voltages from a "noise" source mix with DC signals conducted along signal wiring, the results are usually undesirable. For this reason, power wiring and low-level signal wiring should always be routed through separated, dedicated metal conduit, and signals should be conducted via 2-conductor "twisted pair" cable rather than through a single wire and ground connection:
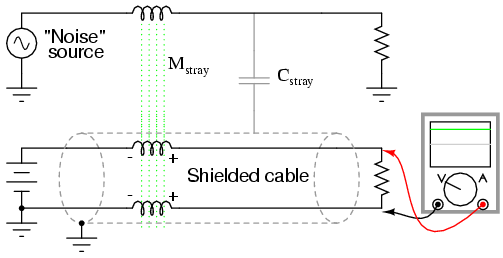
The grounded cable shield -- a wire braid or metal foil wrapped around the two insulated conductors -- isolates both conductors from electrostatic (capacitive) coupling by blocking any external electric fields, while the parallal proximity of the two conductors effectively cancels any electromagnetic (mutually inductive) coupling because any induced noise voltage will be approximately equal in magnitude and opposite in phase along both conductors, canceling each other at the receiving end for a net (differential) noise voltage of almost zero. Polarity marks placed near each inductive portion of signal conductor length shows how the induced voltages are phased in such a way as to cancel one another.
Coupling may also occur between two sets of conductors carrying AC signals, in which case both signals may become "mixed" with each other:

Coupling is but one example of how signals of different frequencies may become mixed. Whether it be AC mixed with DC, or two AC signals mixing with each other, signal coupling via stray inductance and capacitance is usually accidental and undesired. In other cases, mixed-frequency signals are the result of intentional design or they may be an intrinsic quality of a signal. It is generally quite easy to create mixed-frequency signal sources. Perhaps the easiest way is to simply connect voltage sources in series:
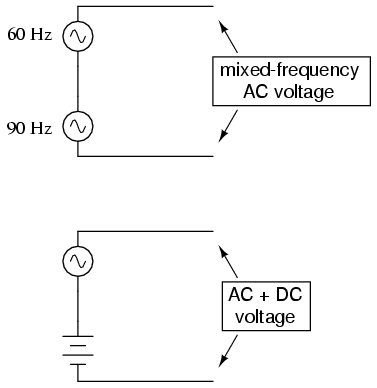
Some computer communications networks operate on the principle of superimposing high-frequency voltage signals along 60 Hz power-line conductors, so as to convey computer data along existing lengths of power cabling. This technique has been used for years in electric power distribution networks to communicate load data along high-voltage power lines. Certainly these are examples of mixed-frequency AC voltages, under conditions that are deliberately established.
In some cases, mixed-frequency signals may be produced by a single voltage source. Such is the case with microphones, which convert audio-frequency air pressure waves into corresponding voltage waveforms. The particular mix of frequencies in the voltage signal output by the microphone is dependent on the sound being reproduced. If the sound waves consist of a single, pure note or tone, the voltage waveform will likewise be a sine wave at a single frequency. If the sound wave is a chord or other harmony of several notes, the resulting voltage waveform produced by the microphone will consist of those frequencies mixed together. Very few natural sounds consist of single, pure sine wave vibrations but rather are a mix of different frequency vibrations at different amplitudes.
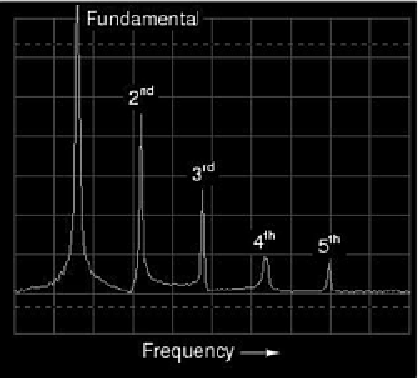
Musical chords are produced by blending one frequency with other frequencies of particular fractional multiples of the first. However, investigating a little further, we find that even a single piano note (produced by a plucked string) consists of one predominant frequency mixed with several other frequencies, each frequency a whole-number multiple of the first (called harmonics, while the first frequency is called the fundamental). An illustration of these terms is shown below with a fundamental frequency of 1000 Hz (an arbitrary figure chosen for this example), each of the frequency multiples appropriately labeled:
FOR A "BASE" FREQUENCY OF 1000 Hz:
Frequency (Hz)           Term
-------------------------------------------
1000 --------- 1st harmonic, or fundamental
2000 --------- 2nd harmonic
3000 --------- 3rd harmonic
4000 --------- 4th harmonic
5000 --------- 5th harmonic
6000 --------- 6th harmonic
7000 --------- 7th harmonic
ad infinitum
Sometimes the term "overtone" is used to describe the a harmonic frequency produced by a musical instrument. The "first" overtone is the first harmonic frequency greater than the fundamental. If we had an instrument producing the entire range of harmonic frequencies shown in the table above, the first overtone would be 2000 Hz (the 2nd harmonic), while the second overtone would be 3000 Hz (the 3rd harmonic), etc. However, this application of the term "overtone" is specific to particular instruments.
It so happens that certain instruments are incapable of producing certain types of harmonic frequencies. For example, an instrument made from a tube that is open on one end and closed on the other (such as a bottle, which produces sound when air is blown across the opening) is incapable of producing even-numbered harmonics. Such an instrument set up to produce a fundamental frequency of 1000 Hz would also produce frequencies of 3000 Hz, 5000 Hz, 7000 Hz, etc, but would not produce 2000 Hz, 4000 Hz, 6000 Hz, or any other even-multiple frequencies of the fundamental. As such, we would say that the first overtone (the first frequency greater than the fundamental) in such an instrument would be 3000 Hz (the 3rd harmonic), while the second overtone would be 5000 Hz (the 5th harmonic), and so on.
A pure sine wave (single frequency), being entirely devoid of any harmonics, sounds very "flat" and "featureless" to the human ear. Most musical instruments are incapable of producing sounds this simple. What gives each instrument its distinctive tone is the same phenomenon that gives each person a distinctive voice: the unique blending of harmonic waveforms with each fundamental note, described by the physics of motion for each unique object producing the sound.
Brass instruments do not possess the same "harmonic content" as woodwind instruments, and neither produce the same harmonic content as stringed instruments. A distinctive blend of frequencies is what gives a musical instrument its characteristic tone. As anyone who has played guitar can tell you, steel strings have a different sound than nylon strings. Also, the tone produced by a guitar string changes depending on where along its length it is plucked. These differences in tone, as well, are a result of different harmonic content produced by differences in the mechanical vibrations of an instrument's parts. All these instruments produce harmonic frequencies (whole-number multiples of the fundamental frequency) when a single note is played, but the relative amplitudes of those harmonic frequencies are different for different instruments. In musical terms, the measure of a tone's harmonic content is called timbre or color.
Musical tones become even more complex when the resonating element of an instrument is a two-dimensional surface rather than a one-dimensional string. Instruments based on the vibration of a string (guitar, piano, banjo, lute, dulcimer, etc.) or of a column of air in a tube (trumpet, flute, clarinet, tuba, pipe organ, etc.) tend to produce sounds composed of a single frequency (the "fundamental") and a mix of harmonics. Instruments based on the vibration of a flat plate (steel drums, and some types of bells), however, produce a much broader range of frequencies, not limited to whole-number multiples of the fundamental. The result is a distinctive tone that some people find acoustically offensive.
As you can see, music provides a rich field of study for mixed frequencies and their effects. Later sections of this chapter will refer to musical instruments as sources of waveforms for analysis in more detail.
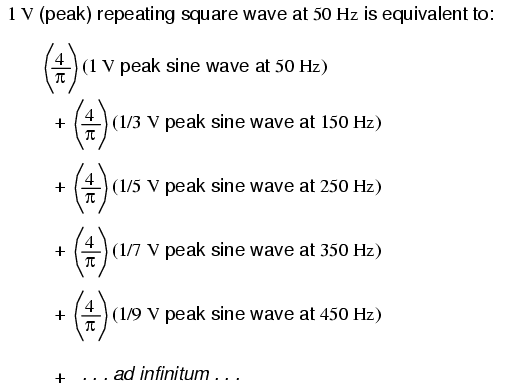
It has been found that any repeating, non-sinusoidal waveform can be equated to a combination of DC voltage, sine waves, and/or cosine waves (sine waves with a 90 degree phase shift) at various amplitudes and frequencies. This is true no matter how strange or convoluted the waveform in question may be. So long as it repeats itself regularly over time, it is reducible to this series of sinusoidal waves. In particular, it has been found that square waves are mathematically equivalent to the sum of a sine wave at that same frequency, plus an infinite series of odd-multiple frequency sine waves at diminishing amplitude:
This truth about waveforms at first may seem too strange to believe. However, if a square wave is actually an infinite series of sine wave harmonics added together, it stands to reason that we should be able to prove this by adding together several sine wave harmonics to produce a close approximation of a square wave. This reasoning is not only sound, but easily demonstrated with SPICE.
The circuit we'll be simulating is nothing more than several sine wave AC voltage sources of the proper amplitudes and frequencies connected together in series. We'll use SPICE to plot the voltage waveforms across successive additions of voltage sources, like this:
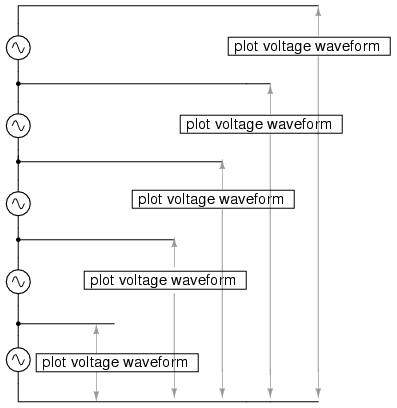
In this particular SPICE simulation, I've summed the 1st, 3rd, 5th, 7th, and 9th harmonic voltage sources in series for a total of five AC voltage sources. The fundamental frequency is 50 Hz and each harmonic is, of course, an integer multiple of that frequency. The amplitude (voltage) figures are not random numbers; rather, they have been arrived at through the equations shown in the frequency series (the fraction 4/π multiplied by 1, 1/3, 1/5, 1/7, etc. for each of the increasing odd harmonics).
building a squarewave
v1 1 0 sin (0 1.27324 50 0 0)       1st harmonic (50 Hz)
v3 2 1 sin (0 424.413m 150 0 0)     3rd harmonic
v5 3 2 sin (0 254.648m 250 0 0)     5th harmonic
v7 4 3 sin (0 181.891m 350 0 0)     7th harmonic
v9 5 4 sin (0 141.471m 450 0 0)     9th harmonic
r1 5 0 10k
.tran 1m 20m
.plot tran v(1,0)    Plot 1st harmonic
.plot tran v(2,0)    Plot 1st + 3rd harmonics
.plot tran v(3,0)    Plot 1st + 3rd + 5th harmonics
.plot tran v(4,0)    Plot 1st + 3rd + 5th + 7th harmonics
.plot tran v(5,0)    Plot 1st + . . . + 9th harmonics
.end
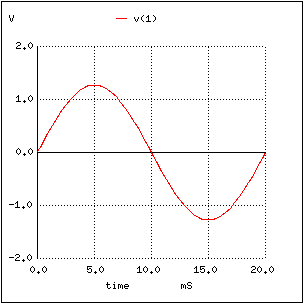
I'll narrate the analysis step by step from here, explaining what it is we're looking at. In this first plot, we see the fundamental-frequency sine-wave of 50 Hz by itself. It is nothing but a pure sine shape, with no additional harmonic content. This is the kind of waveform produced by an ideal AC power source:
Next, we see what happens when this clean and simple waveform is combined with the third harmonic (three times 50 Hz, or 150 Hz). Suddenly, it doesn't look like a clean sine wave any more:

The rise and fall times between positive and negative cycles are much steeper now, and the crests of the wave are closer to becoming flat like a squarewave. Watch what happens as we add the next odd harmonic frequency:
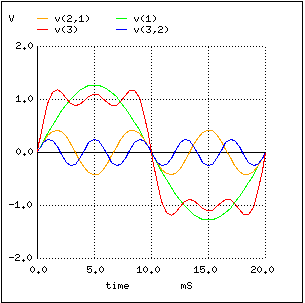
The most noticeable change here is how the crests of the wave have flattened even more. There are more several dips and crests at each end of the wave, but those dips and crests are smaller in amplitude than they were before. Watch again as we add the next odd harmonic waveform to the mix:

Here we can see the wave becoming flatter at each peak. Finally, adding the 9th harmonic, the fifth sine wave voltage source in our circuit, we obtain this result:

The end result of adding the first five odd harmonic waveforms together (all at the proper amplitudes, of course) is a close approximation of a square wave. The point in doing this is to illustrate how we can build a square wave up from multiple sine waves at different frequencies, to prove that a pure square wave is actually equivalent to a series of sine waves. When a square wave AC voltage is applied to a circuit with reactive components (capacitors and inductors), those components react as if they were being exposed to several sine wave voltages of different frequencies, which in fact they are.
The fact that repeating, non-sinusoidal waves are equivalent to a definite series of additive DC voltage, sine waves, and/or cosine waves is a consequence of how waves work: a fundamental property of all wave-related phenomena, electrical or otherwise. The mathematical process of reducing a non-sinusoidal wave into these constituent frequencies is called Fourier analysis, the details of which are well beyond the scope of this text. However, computer algorithms have been created to perform this analysis at high speeds on real waveforms, and its application in AC power quality and signal analysis is widespread.
SPICE has the ability to sample a waveform and reduce it into its constituent sine wave harmonics by way of a Fourier Transform algorithm, outputting the frequency analysis as a table of numbers. Let's try this on a square wave, which we already know is composed of odd-harmonic sine waves:
squarewave analysis netlist
v1 1 0 pulse (-1 1 0 .1m .1m 10m 20m)
r1 1 0 10k
.tran 1m 40m
.plot tran v(1,0)
.four 50 v(1,0)
.end
The pulse option in the netlist line describing voltage source v1 instructs SPICE to simulate a square-shaped "pulse" waveform, in this case one that is symmetrical (equal time for each half-cycle) and has a peak amplitude of 1 volt. First we'll plot the square wave to be analyzed:
Here, SPICE has broken the waveform down into a spectrum of sinusoidal frequencies up to the ninth harmonic, plus a small DC voltage labelled DC component. I had to inform SPICE of the fundamental frequency (for a square wave with a 20 millisecond period, this frequency is 50 Hz), so it knew how to classify the harmonics. Note how small the figures are for all the even harmonics (2nd, 4th, 6th, 8th), and how the amplitudes of the odd harmonics diminish (1st is largest, 9th is smallest).
This same technique of "Fourier Transformation" is often used in computerized power instrumentation, sampling the AC waveform(s) and determining the harmonic content thereof. A common computer algorithm (sequence of program steps to perform a task) for this is the Fast Fourier Transform or FFT function. You need not be concerned with exactly how these computer routines work, but be aware of their existence and application.
This same mathematical technique used in SPICE to analyze the harmonic content of waves can be applied to the technical analysis of music: breaking up any particular sound into its constituent sine-wave frequencies. In fact, you may have already seen a device designed to do just that without realizing what it was! A graphic equalizer is a piece of high-fidelity stereo equipment that controls (and sometimes displays) the nature of music's harmonic content. Equipped with several knobs or slide levers, the equalizer is able to selectively attenuate (reduce) the amplitude of certain frequencies present in music, to "customize" the sound for the listener's benefit. Typically, there will be a "bar graph" display next to each control lever, displaying the amplitude of each particular frequency.
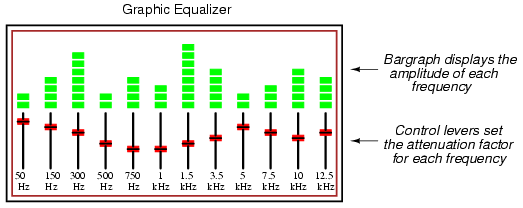
A device built strictly to display -- not control -- the amplitudes of each frequency range for a mixed-frequency signal is typically called a spectrum analyzer. The design of spectrum analyzers may be as simple as a set of "filter" circuits (see the next chapter for details) designed to separate the different frequencies from each other, or as complex as a special-purpose digital computer running an FFT algorithm to mathematically split the signal into its harmonic components. Spectrum analyzers are often designed to analyze extremely high-frequency signals, such as those produced by radio transmitters and computer network hardware. In that form, they often have an appearance like that of an oscilloscope:

Like an oscilloscope, the spectrum analyzer uses a CRT (or a computer display mimicking a CRT) to display a plot of the signal. Unlike an oscilloscope, this plot is amplitude over frequency rather than amplitude over time. In essence, a frequency analyzer gives the operator a Bode plot of the signal: something an engineer might call a frequency-domain rather than a time-domain analysis.
The term "domain" is mathematical: a sophisticated word to describe the horizontal axis of a graph. Thus, an oscilloscope's plot of amplitude (vertical) over time (horizontal) is a "time-domain" analysis, whereas a spectrum analyzer's plot of amplitude (vertical) over frequency (horizontal) is a "frequency-domain" analysis. When we use SPICE to plot signal amplitude (either voltage or current amplitude) over a range of frequencies, we are performing frequency-domain analysis.
Please take note of how the Fourier analysis from the last SPICE simulation isn't "perfect." Ideally, the amplitudes of all the even harmonics should be absolutely zero, and so should the DC component. Again, this is not so much a quirk of SPICE as it is a property of waveforms in general. A waveform of infinite duration (infinite number of cycles) can be analyzed with absolute precision, but the less cycles available to the computer for analysis, the less precise the analysis. It is only when we have an equation describing a waveform in its entirety that Fourier analysis can reduce it to a definite series of sinusoidal waveforms. The fewer times that a wave cycles, the less certain its frequency is. Taking this concept to its logical extreme, a short pulse -- a waveform that doesn't even complete a cycle -- actually has no frequency, but rather acts as an infinite range of frequencies. This principle is common to all wave-based phenomena, not just AC voltages and currents.
Suffice it to say that the number of cycles and the certainty of a waveform's frequency component(s) are directly related. We could improve the precision of our analysis here by letting the wave oscillate on and on for many cycles, and the result would be a spectrum analysis more consistent with the ideal. In the following analysis, I've omitted the waveform plot for brevity's sake -- it's just a really long square wave:
squarewave
v1 1 0 pulse (-1 1 0 .1m .1m 10m 20m)
r1 1 0 10k
.option limpts=1001
.tran 1m 1
.plot tran v(1,0)
.four 50 v(1,0)
.end
fourier components of transient response v(1)
dc component =   9.999E-03
harmonic  frequency    fourier    normalized   phase   normalized
no           (hz)     component   component    (deg)   phase (deg)
1         5.000E+01   1.273E+00     1.000000    -1.800       0.000
2         1.000E+02   1.999E-02     0.015704    86.382      88.182
3         1.500E+02   4.238E-01     0.332897    -5.400      -3.600
4         2.000E+02   1.997E-02     0.015688    82.764      84.564
5         2.500E+02   2.536E-01     0.199215    -9.000      -7.200
6         3.000E+02   1.994E-02     0.015663    79.146      80.946
7         3.500E+02   1.804E-01     0.141737   -12.600     -10.800
8         4.000E+02   1.989E-02     0.015627    75.529      77.329
9         4.500E+02   1.396E-01     0.109662   -16.199     -14.399
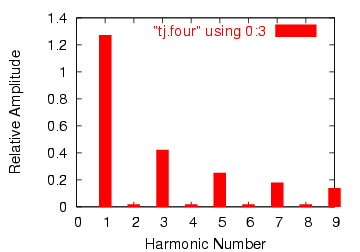
Notice how this analysis shows less of a DC component voltage and lower amplitudes for each of the even harmonic frequency sine waves, all because we let the computer sample more cycles of the wave. Again, the imprecision of the first analysis is not so much a flaw in SPICE as it is a fundamental property of waves and of signal analysis.
As strange as it may seem, any repeating, non-sinusoidal waveform is actually equivalent to a series of sinusoidal waveforms of different amplitudes and frequencies added together. Square waves are a very common and well-understood case, but not the only one.
Electronic power control devices such as transistors and silicon-controlled rectifiers (SCRs) often produce voltage and current waveforms that are essentially chopped-up versions of the otherwise "clean" (pure) sine-wave AC from the power supply. These devices have the ability to suddenly change their resistance with the application of a control signal voltage or current, thus "turning on" or "turning off" almost instantaneously, producing current waveforms bearing little resemblance to the source voltage waveform powering the circuit. These current waveforms then produce changes in the voltage waveform to other circuit components, due to voltage drops created by the non-sinusoidal current through circuit impedances.
Circuit components that distort the normal sine-wave shape of AC voltage or current are called nonlinear. Nonlinear components such as SCRs find popular use in power electronics due to their ability to regulate large amounts of electrical power without dissipating much heat. While this is an advantage from the perspective of energy efficiency, the waveshape distortions they introduce can cause problems.
These non-sinusoidal waveforms, regardless of their actual shape, are equivalent to a series of sinusoidal waveforms of higher (harmonic) frequencies. If not taken into consideration by the circuit designer, these harmonic waveforms created by electronic switching components may cause erratic circuit behavior. It is becoming increasingly common in the electric power industry to observe overheating of transformers and motors due to distortions in the sine-wave shape of the AC power line voltage stemming from "switching" loads such as computers and high-efficiency lights. This is no theoretical exercise: it is very real and potentially very troublesome.
In this section, I will investigate a few of the more common waveshapes and show their harmonic components by way of Fourier analysis using SPICE.
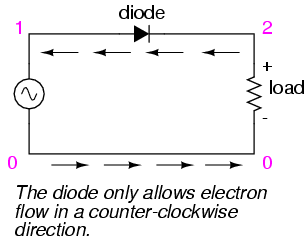
One very common way harmonics are generated in an AC power system is when AC is converted, or "rectified" into DC. This is generally done with components called diodes, which only allow the passage of current in one direction. The simplest type of AC/DC rectification is half-wave, where a single diode blocks half of the AC current (over time) from passing through the load. Oddly enough, the conventional diode schematic symbol is drawn such that electrons flow against the direction of the symbol's arrowhead:
halfwave rectifier
v1 1 0 sin(0 15 60 0 0)
rload 2 0 10k
d1 1 2 mod1
.model mod1 d
.tran .5m 17m
.plot tran v(1,0) v(2,0)
.four 60 v(1,0) v(2,0)
.end
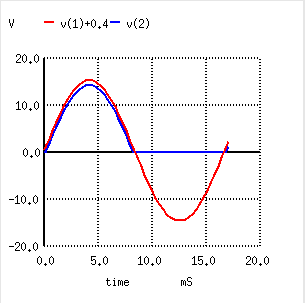
First, we'll see how SPICE analyzes the source waveform, a pure sine wave voltage:
fourier components of transient response v(1)
dc component =   8.016E-04
harmonic   frequency  fourier    normalized   phase   normalized
no         (hz)      component   component    (deg)   phase (deg)
1        6.000E+01   1.482E+01     1.000000    -0.005       0.000
2        1.200E+02   2.492E-03     0.000168  -104.347    -104.342
3        1.800E+02   6.465E-04     0.000044   -86.663     -86.658
4        2.400E+02   1.132E-03     0.000076   -61.324     -61.319
5        3.000E+02   1.185E-03     0.000080   -70.091     -70.086
6        3.600E+02   1.092E-03     0.000074   -63.607     -63.602
7        4.200E+02   1.220E-03     0.000082   -56.288     -56.283
8        4.800E+02   1.354E-03     0.000091   -54.669     -54.664
9        5.400E+02   1.467E-03     0.000099   -52.660     -52.655
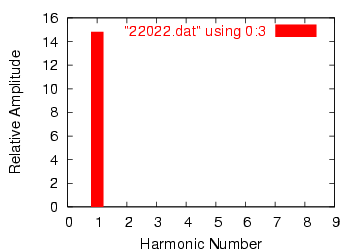
Notice the extremely small harmonic and DC components of this sinusoidal waveform in the table above, though, too small to show on the harmonic plot above. Ideally, there would be nothing but the fundamental frequency showing (being a perfect sine wave), but our Fourier analysis figures aren't perfect because SPICE doesn't have the luxury of sampling a waveform of infinite duration. Next, we'll compare this with the Fourier analysis of the half-wave "rectified" voltage across the load resistor:
fourier components of transient response v(2)
dc component =   4.456E+00
harmonic  frequency   fourier    normalized   phase    normalized
no         (hz)      component   component    (deg)    phase (deg)
1        6.000E+01   7.000E+00     1.000000    -0.195       0.000
2        1.200E+02   3.016E+00     0.430849   -89.765     -89.570
3        1.800E+02   1.206E-01     0.017223  -168.005    -167.810
4        2.400E+02   5.149E-01     0.073556   -87.295     -87.100
5        3.000E+02   6.382E-02     0.009117  -152.790    -152.595
6        3.600E+02   1.727E-01     0.024676   -79.362     -79.167
7        4.200E+02   4.492E-02     0.006417  -132.420    -132.224
8        4.800E+02   7.493E-02     0.010703   -61.479     -61.284
9        5.400E+02   4.051E-02     0.005787  -115.085    -114.889
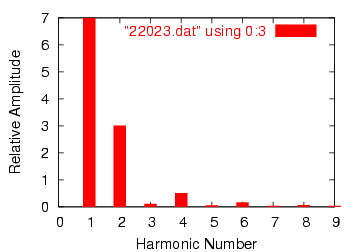
Notice the relatively large even-multiple harmonics in this analysis. By cutting out half of our AC wave, we've introduced the equivalent of several higher-frequency sinusoidal (actually, cosine) waveforms into our circuit from the original, pure sine-wave. Also take note of the large DC component: 4.456 volts. Because our AC voltage waveform has been "rectified" (only allowed to push in one direction across the load rather than back-and-forth), it behaves a lot more like DC.
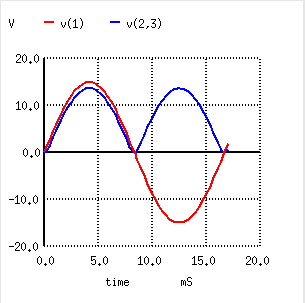
Another method of AC/DC conversion is called full-wave, which as you may have guessed utilizes the full cycle of AC power from the source, reversing the polarity of half the AC cycle to get electrons to flow through the load the same direction all the time. I won't bore you with details of exactly how this is done, but we can examine the waveform and its harmonic analysis through SPICE:
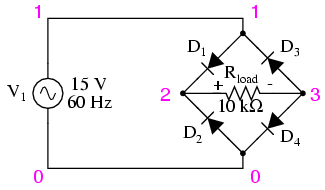
fullwave bridge rectifier
v1 1 0 sin(0 15 60 0 0)
rload 2 3 10k
d1 1 2 mod1
d2 0 2 mod1
d3 3 1 mod1
d4 3 0 mod1
.model mod1 d
.tran .5m 17m
.plot tran v(1,0) v(2,3)
.four 60 v(2,3)
.end
fourier components of transient response v(2,3)
dc component =   8.273E+00
harmonic   frequency  fourier    normalized   phase   normalized
no         (hz)      component   component    (deg)   phase (deg)
1        6.000E+01   7.000E-02     1.000000   -93.519       0.000
2        1.200E+02   5.997E+00    85.669415   -90.230       3.289
3        1.800E+02   7.241E-02     1.034465   -93.787      -0.267
4        2.400E+02   1.013E+00    14.465161   -92.492       1.027
5        3.000E+02   7.364E-02     1.052023   -95.026      -1.507
6        3.600E+02   3.337E-01     4.767350  -100.271      -6.752
7        4.200E+02   7.496E-02     1.070827   -94.023      -0.504
8        4.800E+02   1.404E-01     2.006043  -118.839     -25.319
9        5.400E+02   7.457E-02     1.065240   -90.907       2.612
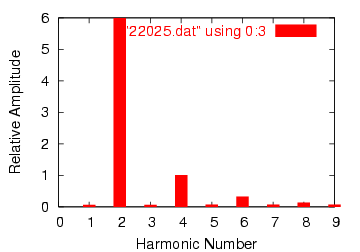
What a difference! According to SPICE's Fourier transform, we have a 2nd harmonic component to this waveform that's over 85 times the amplitude of the original AC source frequency! The DC component of this wave shows up as being 8.273 volts (almost twice what is was for the half-wave rectifier circuit) while the second harmonic is almost 6 volts in amplitude. Notice all the other harmonics further on down the table. The odd harmonics are actually stronger at some of the higher frequencies than they are at the lower frequencies, which is interesting.
As you can see, what may begin as a neat, simple AC sine-wave may end up as a complex mess of harmonics after passing through just a few electronic components. While the complex mathematics behind all this Fourier transformation is not necessary for the beginning student of electric circuits to understand, it is of the utmost importance to realize the principles at work and to grasp the practical effects that harmonic signals may have on circuits. The practical effects of harmonic frequencies in circuits will be explored in the last section of this chapter, but before we do that we'll take a closer look at waveforms and their respective harmonics.
Computerized Fourier analysis, particularly in the form of the FFT algorithm, is a powerful tool for furthering our understanding of waveforms and their related spectral components. This same mathematical routine programmed into the SPICE simulator as the .fourier option is also programmed into a variety of electronic test instruments to perform real-time Fourier analysis on measured signals. This section is devoted to the use of such tools and the analysis of several different waveforms.
First we have a simple sine wave at a frequency of 523.25 Hz. This particular frequency value is a "C" pitch on a piano keyboard, one octave above "middle C". Actually, the signal measured for this demonstration was created by an electronic keyboard set to produce the tone of a panflute, the closest instrument "voice" I could find resembling a perfect sine wave. The plot below was taken from an oscilloscope display, showing signal amplitude (voltage) over time:
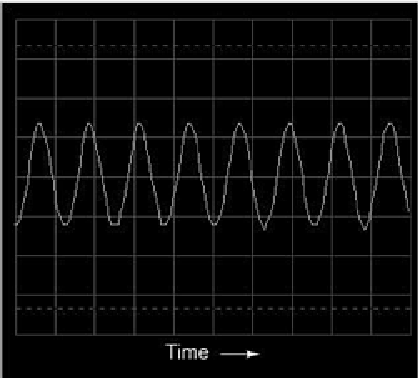
Viewed with an oscilloscope, a sine wave looks like a wavy curve traced horizontally on the screen. The horizontal axis of this oscilloscope display is marked with the word "Time" and an arrow pointing in the direction of time's progression. The curve itself, of course, represents the cyclic increase and decrease of voltage over time.
Close observation reveals imperfections in the sine-wave shape. This, unfortunately, is a result of the specific equipment used to analyze the waveform. Characteristics like these due to quirks of the test equipment are technically known as artifacts: phenomena existing solely because of a peculiarity in the equipment used to perform the experiment.
If we view this same AC voltage on a spectrum analyzer, the result is quite different:
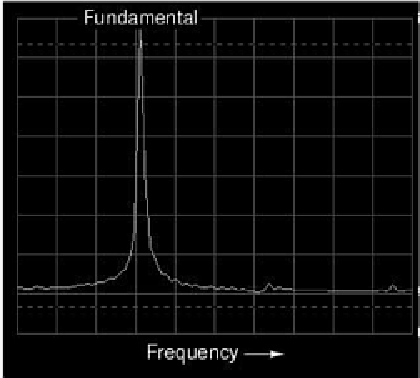
As you can see, the horizontal axis of the display is marked with the word "Frequency," denoting the domain of this measurement. The single peak on the curve represents the predominance of a single frequency within the range of frequencies covered by the width of the display. If the scale of this analyzer instrument were marked with numbers, you would see that this peak occurs at 523.25 Hz. The height of the peak represents the signal amplitude (voltage).
If we mix three different sine-wave tones together on the electronic keyboard (C-E-G, a C-major chord) and measure the result, both the oscilloscope display and the spectrum analyzer display reflect this increased complexity:
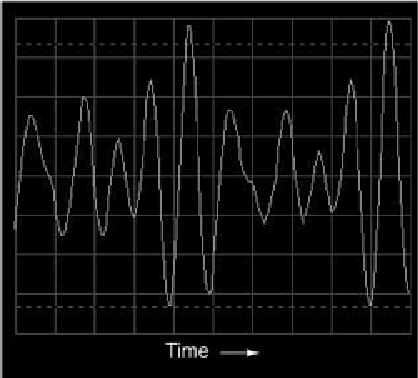
The oscilloscope display (time-domain) shows a waveform with many more peaks and valleys than before, a direct result of the mixing of these three frequencies. As you will notice, some of these peaks are higher than the peaks of the original single-pitch waveform, while others are lower. This is a result of the three different waveforms alternately reinforcing and canceling each other as their respective phase shifts change in time.

The spectrum display (frequency-domain) is much easier to interpret: each pitch is represented by its own peak on the curve. The difference in height between these three peaks is another artifact of the test equipment: a consequence of limitations within the equipment used to generate and analyze these waveforms, and not a necessary characteristic of the musical chord itself.
As was stated before, the device used to generate these waveforms is an electronic keyboard: a musical instrument designed to mimic the tones of many different instruments. The panflute "voice" was chosen for the first demonstrations because it most closely resembled a pure sine wave (a single frequency on the spectrum analyzer display). Other musical instrument "voices" are not as simple as this one, though. In fact, the unique tone produced by any instrument is a function of its waveshape (or spectrum of frequencies). For example, let's view the signal for a trumpet tone:

The fundamental frequency of this tone is the same as in the first panflute example: 523.25 Hz, one octave above "middle C." The waveform itself is far from a pure and simple sine-wave form. Knowing that any repeating, non-sinusoidal waveform is equivalent to a series of sinusoidal waveforms at different amplitudes and frequencies, we should expect to see multiple peaks on the spectrum analyzer display:

Indeed we do! The fundamental frequency component of 523.25 Hz is represented by the left-most peak, with each successive harmonic represented as its own peak along the width of the analyzer screen. The second harmonic is twice the frequency of the fundamental (1046.5 Hz), the third harmonic three times the fundamental (1569.75 Hz), and so on. This display only shows the first six harmonics, but there are many more comprising this complex tone.
Trying a different instrument voice (the accordion) on the keyboard, we obtain a similarly complex oscilloscope (time-domain) plot and spectrum analyzer (frequency-domain) display:

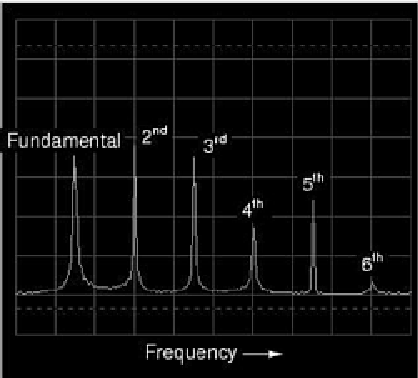
Note the differences in relative harmonic amplitudes (peak heights) on the spectrum displays for trumpet and accordion. Both instrument tones contain harmonics all the way from 1st (fundamental) to 6th (and beyond!), but the proportions aren't the same. Each instrument has a unique harmonic "signature" to its tone. Bear in mind that all this complexity is in reference to a single note played with these two instrument "voices." Multiple notes played on an accordion, for example, would create a much more complex mixture of frequencies than what is seen here.
The analytical power of the oscilloscope and spectrum analyzer permit us to derive general rules about waveforms and their harmonic spectra from real waveform examples. We already know that any deviation from a pure sine-wave results in the equivalent of a mixture of multiple sine-wave waveforms at different amplitudes and frequencies. However, close observation allows us to be more specific than this. Note, for example, the time- and frequency-domain plots for a waveform approximating a square wave:


According to the spectrum analysis, this waveform contains no even harmonics, only odd. Although this display doesn't show frequencies past the sixth harmonic, the pattern of odd-only harmonics in descending amplitude continues indefinitely. This should come as no surprise, as we've already seen with SPICE that a square wave is comprised of an infinitude of odd harmonics. The trumpet and accordion tones, however, contained both even and odd harmonics. This difference in harmonic content is noteworthy. Let's continue our investigation with an analysis of a triangle wave:


In this waveform there are practically no even harmonics: the only significant frequency peaks on the spectrum analyzer display belong to odd-numbered multiples of the fundamental frequency. Tiny peaks can be seen for the second, fourth, and sixth harmonics, but this is due to imperfections in this particular triangle waveshape (once again, artifacts of the test equipment used in this analysis). A perfect triangle waveshape produces no even harmonics, just like a perfect square wave. It should be obvious from inspection that the harmonic spectrum of the triangle wave is not identical to the spectrum of the square wave: the respective harmonic peaks are of different heights. However, the two different waveforms are common in their lack of even harmonics.
Let's examine another waveform, this one very similar to the triangle wave, except that its rise-time is not the same as its fall-time. Known as a sawtooth wave, its oscilloscope plot reveals it to be aptly named:

When the spectrum analysis of this waveform is plotted, we see a result that is quite different from that of the regular triangle wave, for this analysis shows the strong presence of even-numbered harmonics (second and fourth):
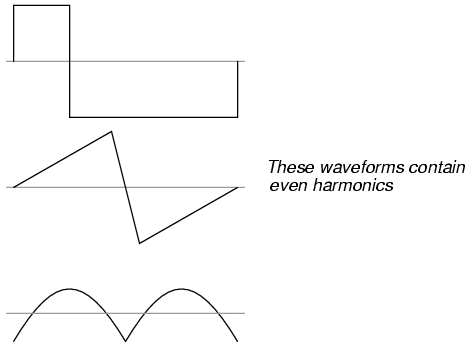
The distinction between a waveform having even harmonics versus no even harmonics resides in the difference between a triangle waveshape and a sawtooth waveshape. That difference is symmetry above and below the horizontal centerline of the wave. A waveform that is symmetrical above and below its centerline (the shape on both sides mirror each other precisely) will contain no even-numbered harmonics.
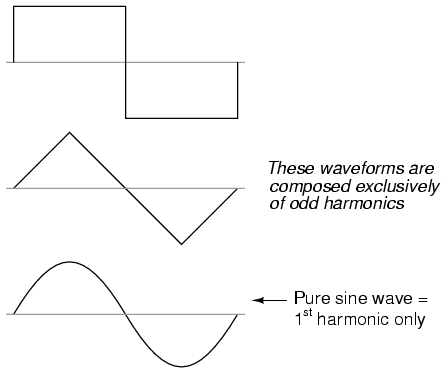
Square waves, triangle waves, and pure sine waves all exhibit this symmetry, and all are devoid of even harmonics. Waveforms like the trumpet tone, the accordion tone, and the sawtooth wave are unsymmetrical around their centerlines and therefore do contain even harmonics.
This principle of centerline symmetry should not be confused with symmetry around the zero line. In the examples shown, the horizontal centerline of the waveform happens to be zero volts on the time-domain graph, but this has nothing to do with harmonic content. This rule of harmonic content (even harmonics only with unsymmetrical waveforms) applies whether or not the waveform is shifted above or below zero volts with a "DC component." For further clarification, I will show the same sets of waveforms, shifted with DC voltage, and note that their harmonic contents are unchanged.
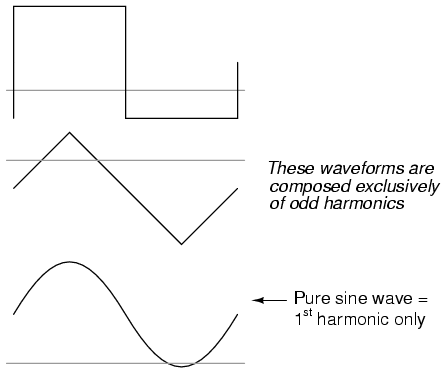
Again, the amount of DC voltage present in a waveform has nothing to do with that waveform's harmonic frequency content.

Why is this harmonic rule-of-thumb an important rule to know? It can help us comprehend the relationship between harmonics in AC circuits and specific circuit components. Since most sources of sine-wave distortion in AC power circuits tend to be symmetrical, even-numbered harmonics are rarely seen in those applications. This is good to know if you're a power system designer and are planning ahead for harmonic reduction: you only have to concern yourself with mitigating the odd harmonic frequencies, even harmonics being practically nonexistent. Also, if you happen to measure even harmonics in an AC circuit with a spectrum analyzer or frequency meter, you know that something in that circuit must be unsymmetrically distorting the sine-wave voltage or current, and that clue may be helpful in locating the source of a problem (look for components or conditions more likely to distort one half-cycle of the AC waveform more than the other).
Now that we have this rule to guide our interpretation of nonsinusoidal waveforms, it makes more sense that a waveform like that produced by a rectifier circuit should contain such strong even harmonics, there being no symmetry at all above and below center.
The principle of non-sinusoidal, repeating waveforms being equivalent to a series of sine waves at different frequencies is a fundamental property of waves in general and it has great practical import in the study of AC circuits. It means that any time we have a waveform that isn't perfectly sine-wave-shaped, the circuit in question will react as though it's having an array of different frequency voltages imposed on it at once.
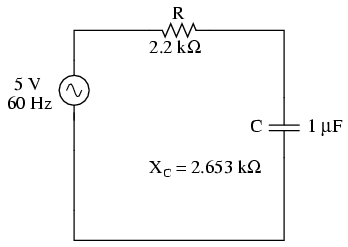
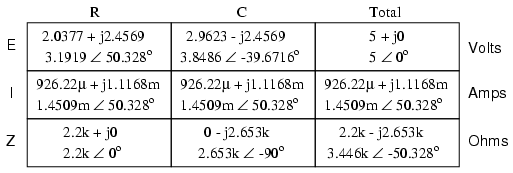
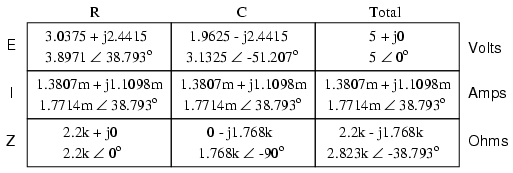
When an AC circuit is subjected to a source voltage consisting of a mixture of frequencies, the components in that circuit respond to each constituent frequency in a different way. Any reactive component such as a capacitor or an inductor will simultaneously present a unique amount of impedance to each and every frequency present in a circuit. Thankfully, the analysis of such circuits is made relatively easy by applying the Superposition Theorem, regarding the multiple-frequency source as a set of single-frequency voltage sources connected in series, and analyzing the circuit for one source at a time, summing the results at the end to determine the aggregate total:

Analyzing circuit for 60 Hz source alone:
Analyzing the circuit for 90 Hz source alone:

Superimposing the voltage drops across R and C, we get:

Because the two voltages across each component are at different frequencies, we cannot consolidate them into a single voltage figure as we could if we were adding together two voltages of different amplitude and/or phase angle at the same frequency. Complex number notation give us the ability to represent waveform amplitude (polar magnitude) and phase angle (polar angle), but not frequency.
What we can tell from this application of the superposition theorem is that there will be a greater 60 Hz voltage dropped across the capacitor than a 90 Hz voltage. Just the opposite is true for the resistor's voltage drop. This is worthy to note, especially in light of the fact that the two source voltages are equal. It is this kind of unequal circuit response to signals of differing frequency that will be our specific focus in the next chapter.
We can also apply the superposition theorem to the analysis of a circuit powered by a non-sinusoidal voltage, such as a square wave. If we know the Fourier series (multiple sine/cosine wave equivalent) of that wave, we can regard it as originating from a series-connected string of multiple sinusoidal voltage sources at the appropriate amplitudes, frequencies, and phase shifts. Needless to say, this can be a laborious task for some waveforms (an accurate square-wave Fourier Series is considered to be expressed out to the ninth harmonic, or five sine waves in all!), but it is possible. I mention this not to scare you, but to inform you of the potential complexity lurking behind seemingly simple waveforms. A real-life circuit will respond just the same to being powered by a square wave as being powered by an infinite series of sine waves of odd-multiple frequencies and diminishing amplitudes. This has been known to translate into unexpected circuit resonances, transformer and inductor core overheating due to eddy currents, electromagnetic noise over broad ranges of the frequency spectrum, and the like. Technicians and engineers need to be made aware of the potential effects of non-sinusoidal waveforms in reactive circuits.
Harmonics are known to manifest their effects in the form of electromagnetic radiation as well. Studies have been performed on the potential hazards of using portable computers aboard passenger aircraft, citing the fact that computers' high frequency square-wave "clock" voltage signals are capable of generating radio waves that could interfere with the operation of the aircraft's electronic navigation equipment. It's bad enough that typical microprocessor clock signal frequencies are within the range of aircraft radio frequency bands, but worse yet is the fact that the harmonic multiples of those fundamental frequencies span an even larger range, due to the fact that clock signal voltages are square-wave in shape and not sine-wave.
Electromagnetic "emissions" of this nature can be a problem in industrial applications, too, with harmonics abounding in very large quantities due to (nonlinear) electronic control of motor and electric furnace power. The fundamental power line frequency may only be 60 Hz, but those harmonic frequency multiples theoretically extend into infinitely high frequency ranges. Low frequency power line voltage and current doesn't radiate into space very well as electromagnetic energy, but high frequencies do.
Also, capacitive and inductive "coupling" caused by close-proximity conductors is usually more severe at high frequencies. Signal wiring nearby power wiring will tend to "pick up" harmonic interference from the power wiring to a far greater extent than pure sine-wave interference. This problem can manifest itself in industry when old motor controls are replaced with new, solid-state electronic motor controls providing greater energy efficiency. Suddenly there may be weird electrical noise being impressed upon signal wiring that never used to be there, because the old controls never generated harmonics, and those high-frequency harmonic voltages and currents tend to inductively and capacitively "couple" better to nearby conductors than any 60 Hz signals from the old controls used to.
Contributors to this chapter are listed in chronological order of their contributions, from most recent to first. See Appendix 2 (Contributor List) for dates and contact information.
Jason Starck (June 2000): HTML document formatting, which led to a much better-looking second edition.
Dennis Crunkilton (May 2005): added nutmeg spice plots
Lessons In Electric Circuits copyright (C) 2000-2005 Tony R. Kuphaldt, under the terms and conditions of the Design Science License.


